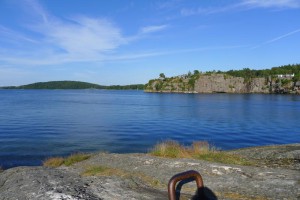
The dramatic coastline of the isles seems to rise just out of the sea. Slussen, Orust island, at the west coast of Sweden. Photo: Lasse Johansson
Slowly, almost imperceptibly, the water level rises. Where are we actually heading? What is the attractor of our present course? Where will we be, when water finds its new level?
Our actions are like a small marble, rolling down a slope, along a ridge, on its way to a new state. Will it be a state where the Arctic ice has melted, where its albedo, its ability to reflect light, has changed from that of white ice to dark water, no longer reflecting most of the light back into the sky? Will it be a state where the methane deposits of the Siberian tundra have molten and evaporated? Where the ice of Greenland has melted?
Rolling along the ridge, we can still alter our course. Further down along the valley, we do not have that chance. We may not be able to choose another valley of attraction.
What is the goal we are striving for, consciously, or by mere inertia? Not more than one degree, if Pacific island countries aren’t to drown. Not more that two degrees, if politicians reach their promised goal. But rather three degrees, the present course of action is heading for.
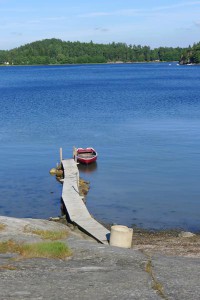
A small jetty, winding down to the water that will define our future. For a geological moment, it will rest here, until the rising water causes the coastline to retreat. Photo: Lasse Johansson
What is then the two degree world, which we seemingly hope to reach? It has been that warm before, but how were then the seas? A world warmer than the Eemian (115 000 years ago), when seas were four to six meters higher than today. More close to the Pliocene (2.6 million years ago), when seas reached another twenty meters up. That is a fact to ponder on.
What will then the rising sea levels mean? For the island countries of the Pacific, it will mean to sink into oblivion. For us in northern Europe, it will mean the loss of our pearls, of most of our coastlines.
For the romantic, it means that places like Smögen, Rügen, and with them the sandy coastlines of the Baltic sea, will be covered by the waves, with Öland cut in two. The coastline of southern Scandinavia will recede, retracing the land rise over a few thousand years, even back to Bronze Age levels.
For the more prosaic, it will mean that coastal cities – like Malmö, Copenhagen, Bremen, Hamburg, and the region around Gdansk – together with most of the Netherlands – will come under water. And with water covering a good part of northern East Anglia, the sea will advance to Cambridge, or engulf it.
Ours is the future to choose, or to choose not.
Read more
The whole climate system, with the oceans, polar ice and atmospheric circulation, can be described as a non-linear system with feedback mechanisms, far from thermodynamic equilibrium – a self-organizing system. Different behaviour can be thought of as different attraction basins. For small changes the system behaves linearly – it oscillates in its valley, moving up a bit along the walls of the valley, and then down again. For larger perturbations, a completely new behaviour can emerge and become structurally stable. E.g. ices melt to new average levels, currents are altered to form new flow patterns. The system has left the present valley and fallen into another attraction basin.
By looking at the small oscillations of the last centuries (or millennia) when predicting climate change, we may be missing the point. Looking at a geological time scale may give us a better perspective.
The U.S. scientists James E. Hansen and Makiko Sato has written an interesting paper comparing paleontological temperature data (e.g. from ocean water) and sea levels with that of today. Their conclusion is that even rather “modest” temperature changes of 1-2 degrees C, may lead to significant changes of the sea level.
- Hansen, J.E. & Sato, M. Paleoclimate implications for human-made climate change Climate Change, p. 21-47, Springer, 2012. (Download the full text)
A popular summary of the paper can be found at NASA’s homepage:
How will the coastlines change at a given sea level rise? Alex Tingle has created a dynamic sea level rise map using data from NASA and existing mapping services. Here you can emulate an arbitrary sea level rise, and see how the maps will be altered. See it for yourself:
- Flood maps by Alex Tingle, flood.firetree.net